Explainable AI (XAI) has demonstrated its potential in deciphering discriminatory features in machine learning (ML) decision-making processes. Specifically, XAI’s feature attribution methods shed light on individual decisions made by ML models. However, despite their visual appeal, these attributions can be unfaithful. To ensure the faithfulness of feature attributions, it is critical to gauge their effectiveness or fidelity. Given the unsupervised nature of measuring the effectiveness of feature attribution, this task proves to be challenging.
Input perturbation has emerged as a viable approach for fidelity testing. However, it is apparent that there are myriad ways to perform input perturbation, and the superior method is yet to be determined [1]. The selected perturbation algorithm should aim to minimize information leakage—referring to the retention of information in the input data in the post-perturbation phase.
Input perturbation’s application in translating ML decisions for human understanding could potentially enhance human trust in the ML decision-making process. This is achieved by elucidating how perturbations in input features impact ML decisions. Our publication, titled as
“A User Interface for Explaining Machine Learning Model Explanations” [2]
earned the Best Demonstration Award at IUI 2023, highlighting the significance of this research.
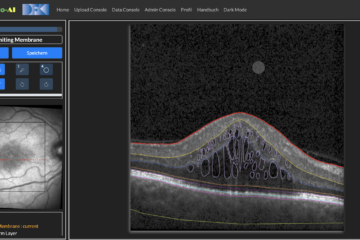
The task of faithfulness evaluation transcends specific models or data types, making it universally applicable. While this project is applicable across various data domains, we will primarily focus on image data and image classification models. This research holds significant relevance in the realm of medical image classification, with applications like Optical Coherence Tomography (OCT) and brain tumor detection.
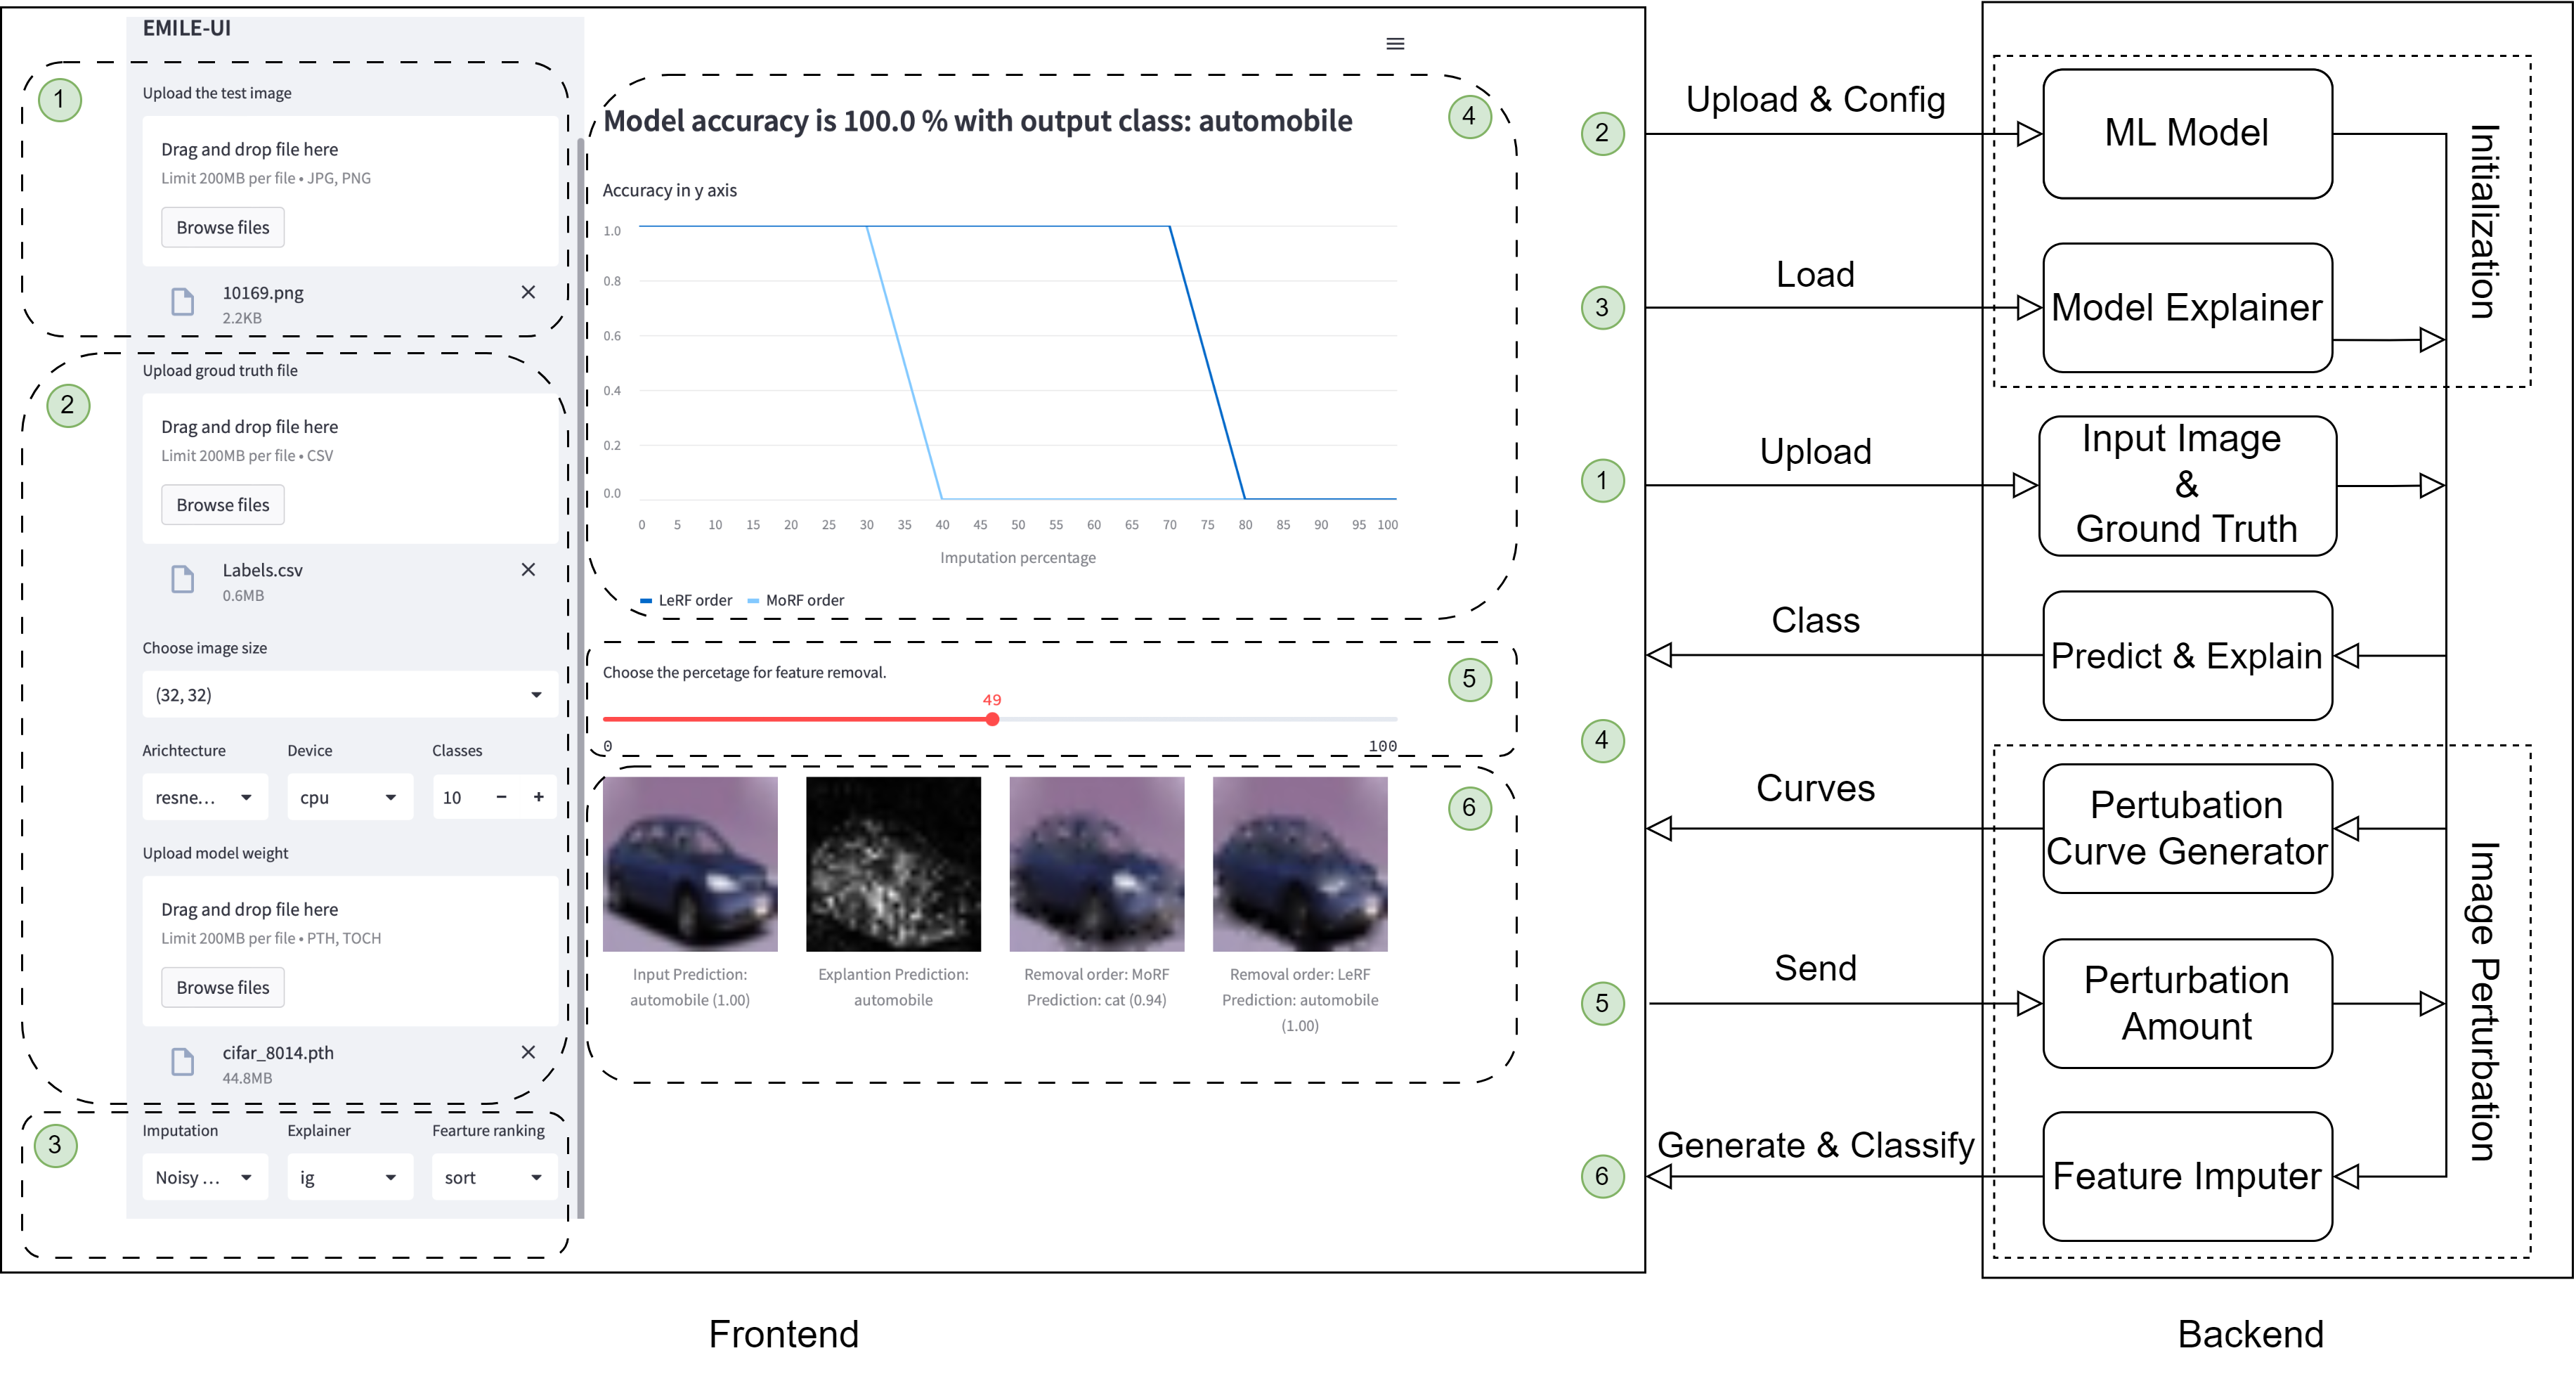
The figure presents the system architecture of our tool with an accompanying UI screenshot. In the frontend, the user uploads the model and its configuration (2). The user then selects the explanation method they want to evaluate (3) and uploads the test image and ground truth (1). Afterwards, the model generates the saliency map (6) and the perturbation curves for that image (4). Using the percentage slider (5) the user selects the amount of feature removal from the input image. The two bottom-right pictures (6) are the resultant images after the feature removal.
References
[1] Kadir, M. A., Mosavi, A., & Sonntag, D. (2023). Assessing XAI: Unveiling evaluation metrics for local explanation, taxonomies, key concepts, and practical applications. doi:10.31224/2989
[2] Kadir, M. A., Mohamed Selim, A., Barz, M., & Sonntag, D. (2023, March 27). A user interface for explaining machine learning model explanations. 28th International Conference on Intelligent User Interfaces. Presented at the IUI ’23: 28th International Conference on Intelligent User Interfaces, Sydney NSW Australia. doi:10.1145/3581754.3584131