Passive acoustic monitoring (PAM), the recording of sounds using microphones (e.g. in biosphere reserves), is an increasingly popular method for continuous, reproducible, scalable and cost-effective monitoring of wildlife [Sugai et al., 2018]. It is widely employed in various fields, including ecology, marine biology, and conservation, to study animal behavior, biodiversity, and environmental changes. While available low-cost recording devices have allowed large-scale data collection, processing this data is a bottleneck.
Currently, domain experts listen to each audio file and annotate events by manually selecting time segments on a graphical representation of the sound (e.g. amplitude envelope or spectrogram). This approach is laborious and incompatible with the large amount of data generated by PAM. We are developing tools for reliable and efficient annotation of PAM datasets.
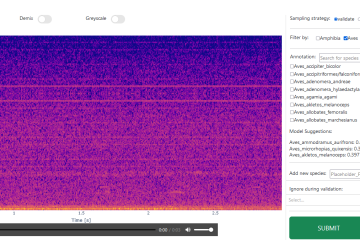
On the one hand, we are using transfer learning and active learning. Our pipeline consists of 2 processing steps: The raw audio data is processed with a pre-trained model. Using an embedding of the pre-trained model, we classify the data with a shallow classification head. The output of the classification head is iteratively improved by the system suggesting the most informative samples to the user for annotation.
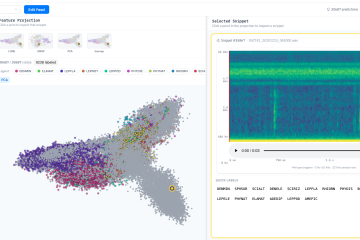
On the other hand, we are exploring the use of actionable visualisations of the latent activations of hidden layers. We project our high-dimensional audio input data into two dimensions that can be displayed on a computer screen. The underlying deep generative model [Rezende et al., 2014] distorts the latent space so that events tend to be outliers and similar events are close together. Users can annotate multiple data points simultaneously by selecting a range. The underlying model is improved through re-training that incorporates new annotated data points. This work will be published as a demo paper at IJCAI23. The following figure shows the user interface:
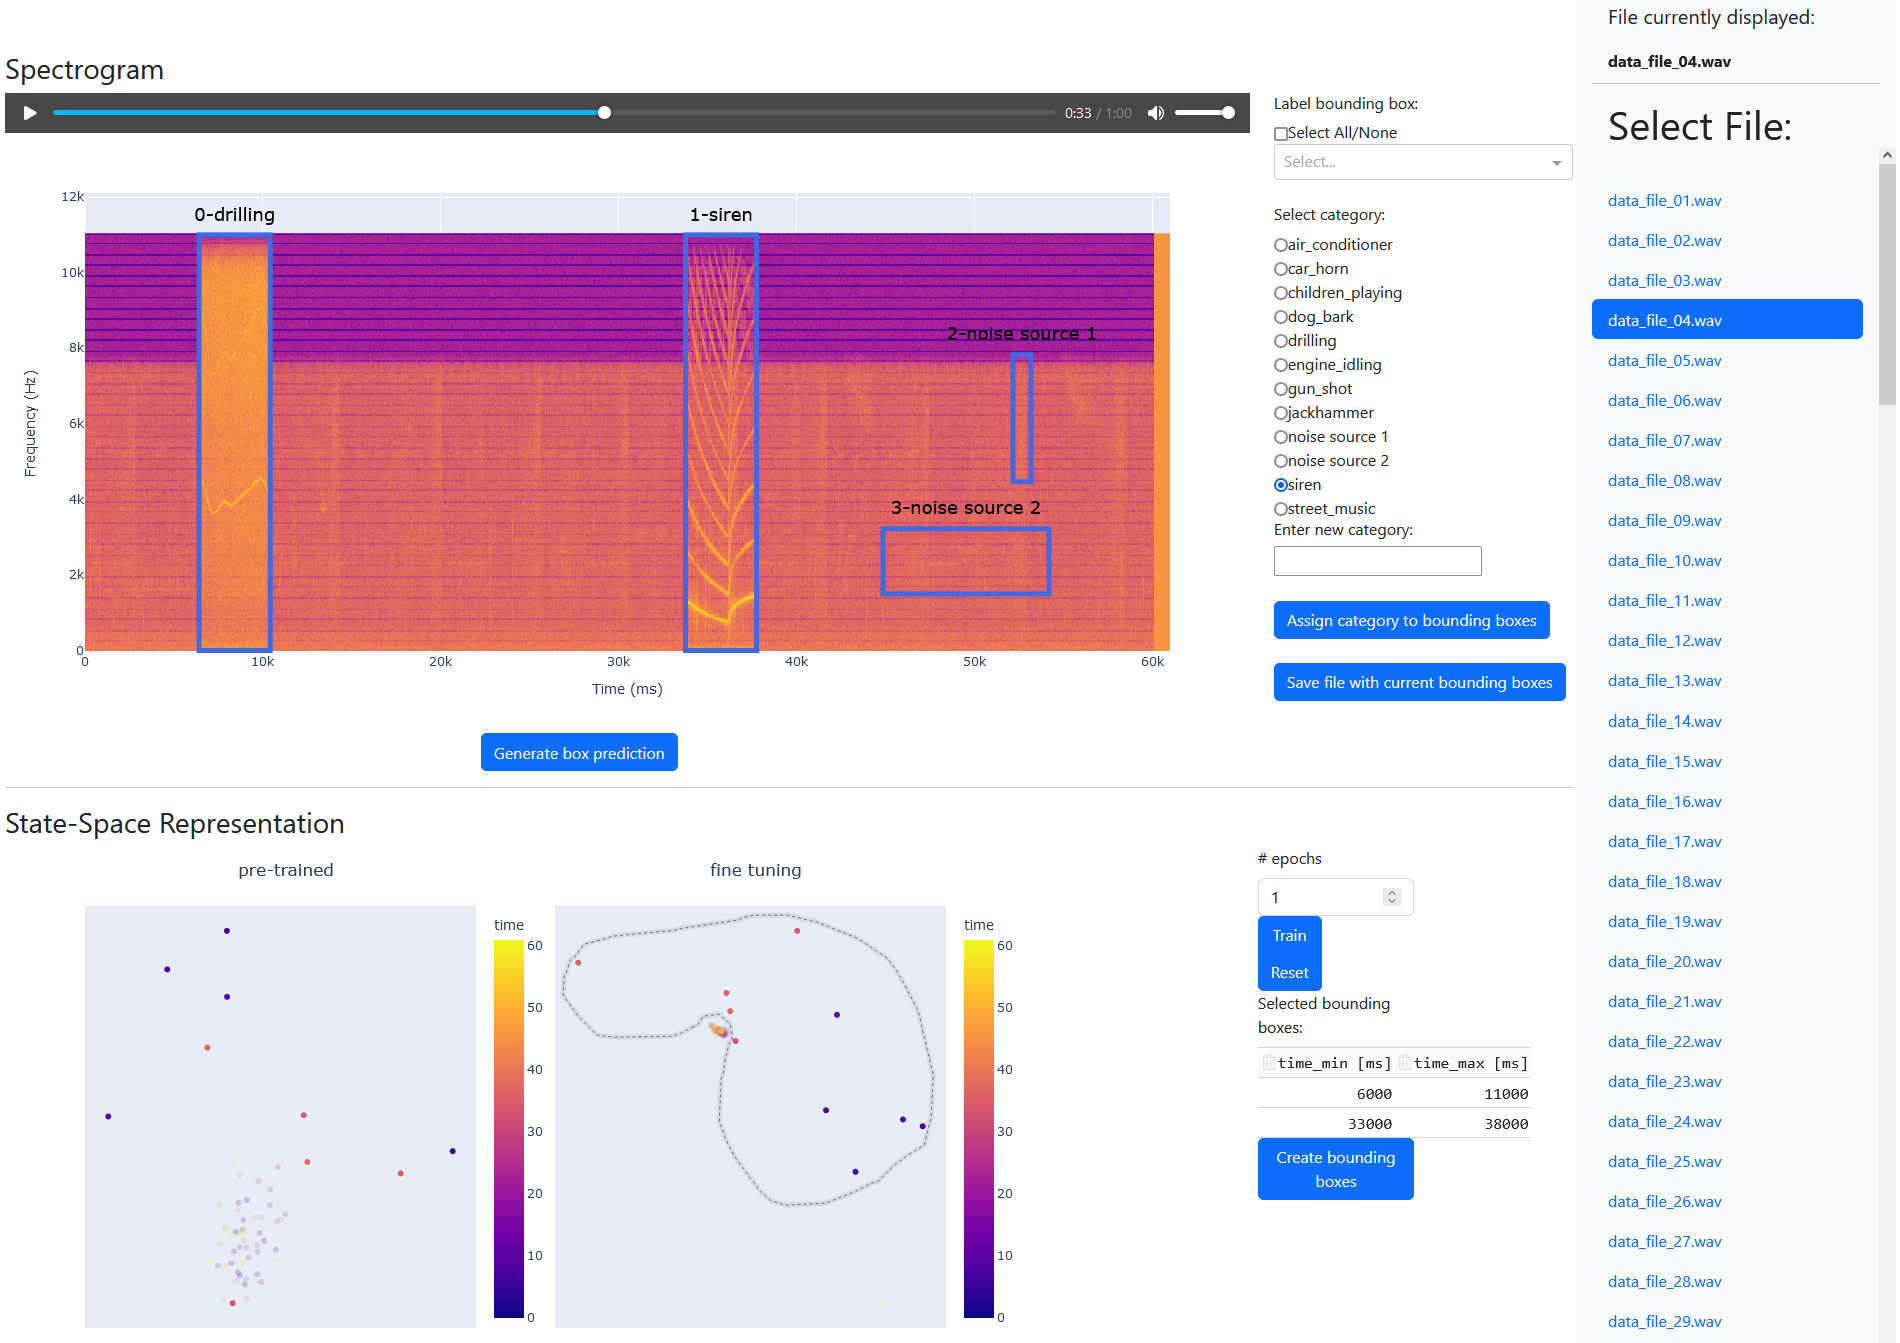
The interface is composed of three parts, namely the file selection bar, the spectrogram interaction row and the state-space interaction row.
The file selection bar allows the user to select an audio file for annotation from a list.
The spectrogram interaction row displays annotation tools over and alongside the spectrogram of the selected file. Spectrograms are an intuitive presentation of raw data. Users can zoom in and out, as well as create and edit time and frequency aligned bounding boxes to annotate regions of interest (ROIs). Selected ROIs can be played as audio. A button below the spectrogram allows quick annotation by suggesting bounding boxes and associated labels. Assigning, changing, and saving labels is possible through selection elements displayed alongside the spectrogram.
More processed representations of the selected audio file are shown in the state-space interaction row, with each dot representing a colour-coded second in both figures. The left figure shows representations of the pre-trained unsupervised learning model, the right figure the fine-tuned model that also processes (generated) annotations. Selected data points are used to create a table of associated times on the right. A button below uses these times to create bounding boxes in the spectrogram. Continuous fine-tuning of the model using all (generated) annotations is possible by selecting a number of epochs and the corresponding button. Another button resets the model to the pre-trained state.
References
[Sugai et al., 2018] Larissa Sayuri Moreira Sugai, Thiago Sanna Freire Silva, Jr Ribeiro, Jos ́e Wagner, and Diego Llusia. Terrestrial Passive Acoustic Monitoring: Review and Perspectives. BioScience, 69(1):15–25, 11 2018.
[Rezende et al., 2014] Danilo Jimenez Rezende, Shakir Mohamed, and Daan Wierstra. Stochastic backpropagation and approximate inference in deep generative models. In Proceedings of the 31th International Conference on Machine Learning, ICML 2014, Beijing, China, 21-26 June 2014, volume 32 of JMLR Workshop and Conference Proceedings, pages 1278–1286. JMLR.org, 2014.